Overview.
Microsoft brought me in to rethink the mobile analytics experience for Xamarin as the product evolved into Visual Studio Mobile Center.
The challenge was not simply showing more data. The bigger opportunity was helping developers understand what changed, how much it changed, and where to investigate next.
Before
Data without context
is not insight.
is not insight.
The existing analytics experience surfaced performance data, but left users to interpret what the numbers meant. Developers needed immediate context: direction, magnitude, comparison period, and a clearer path from high-level movement to event-level detail.
After
Pioneering Contextual
Delta Visualization.
Delta Visualization.
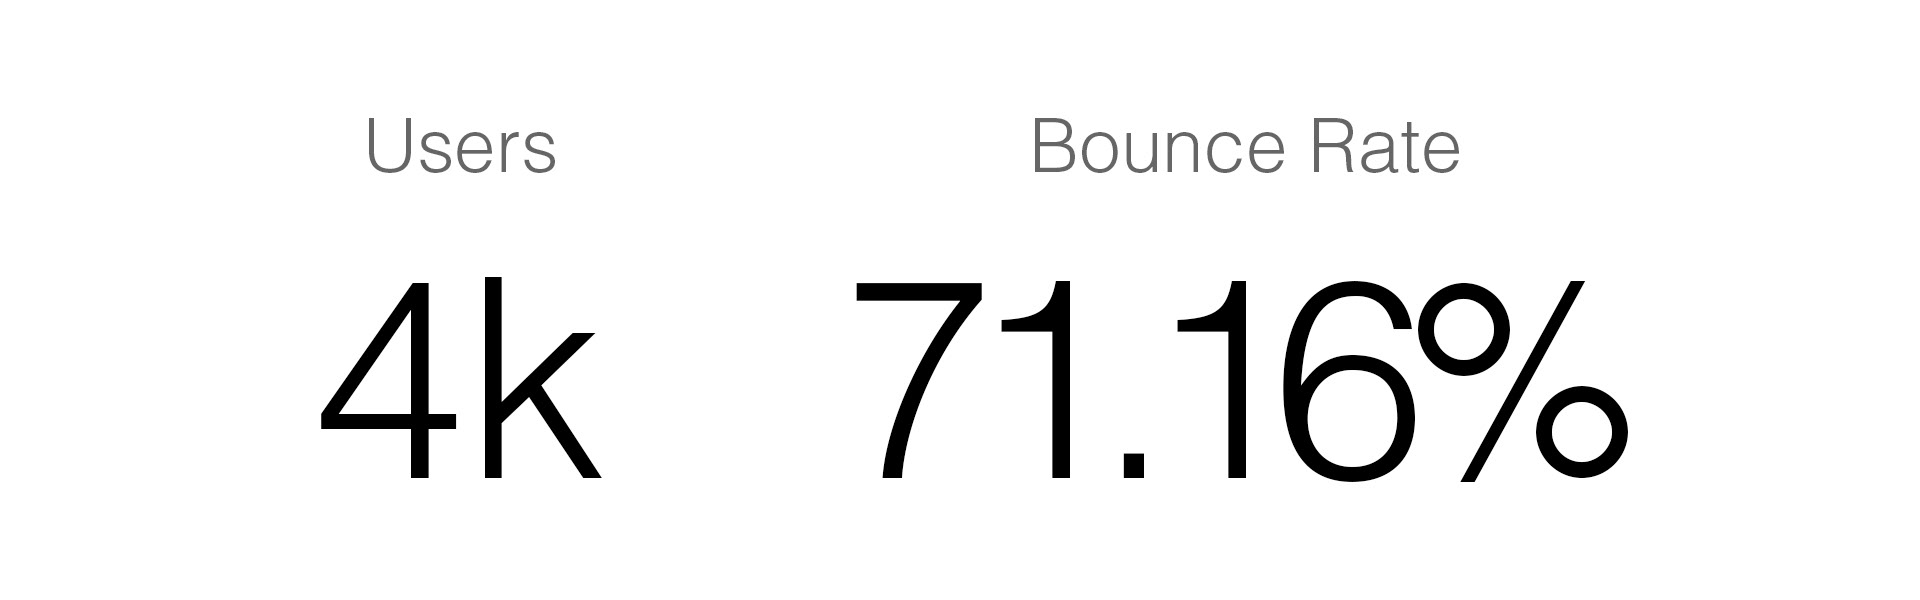
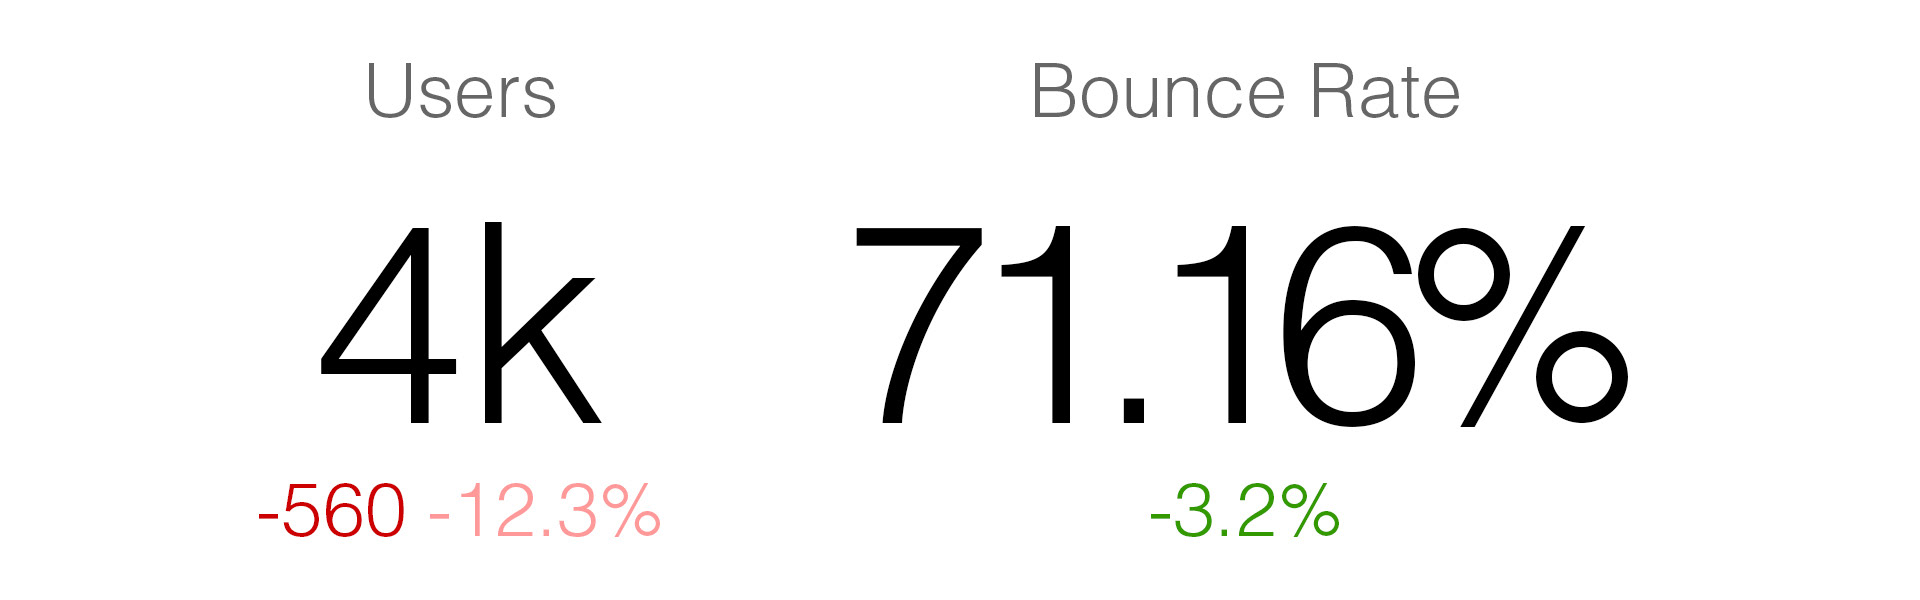
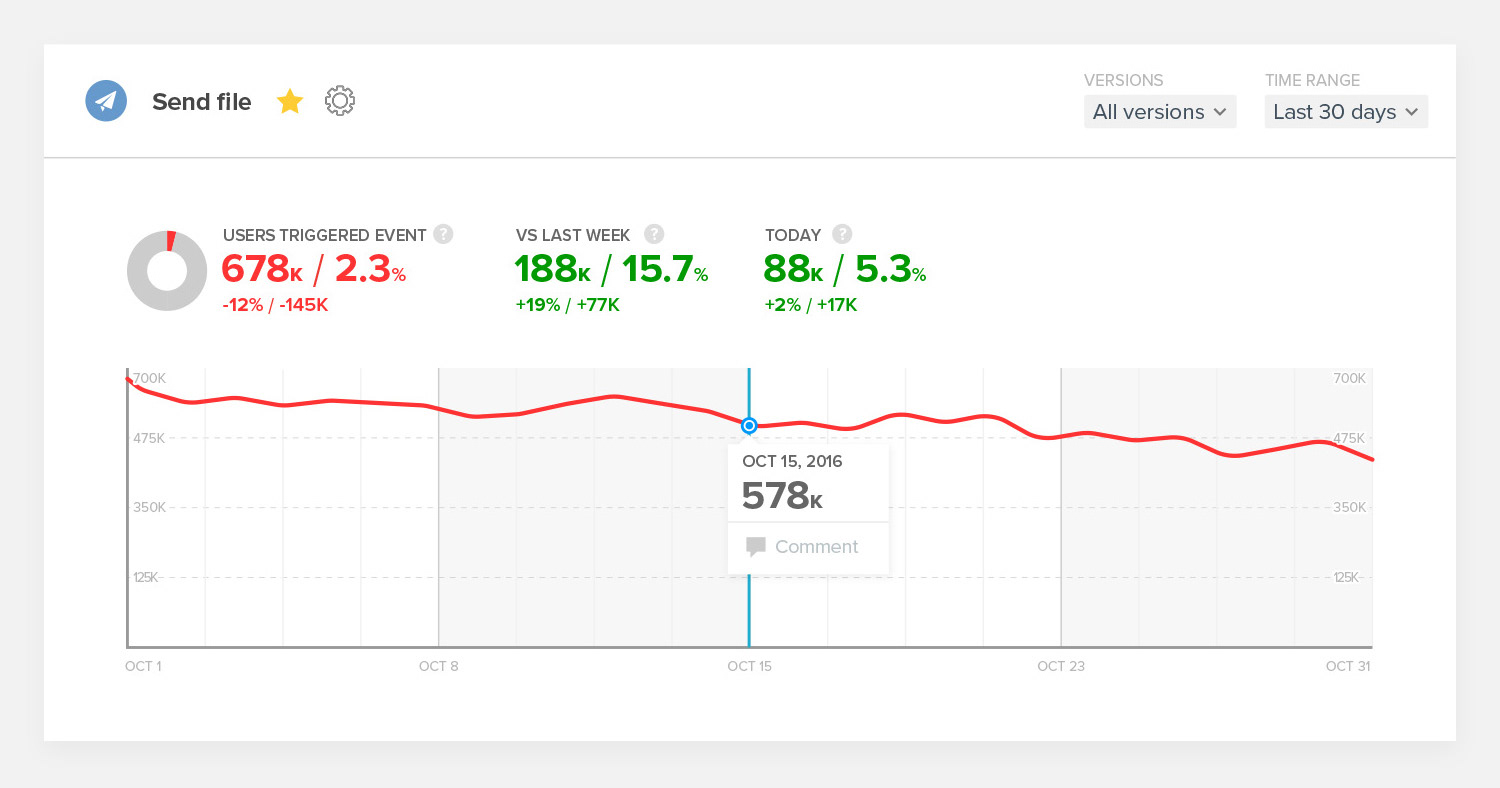
In 2016, I designed a contextual delta model that combined current value, directional change, percentage movement, absolute difference, and comparison context within a single metric component.
The model reduced interpretation effort by showing not only the current state, but how significantly performance changed.
My role.
I led product and interaction design across the analytics dashboard, event exploration, filtering, and future-facing insight concepts—from early product direction through detailed interface design and integration with Microsoft’s existing framework.
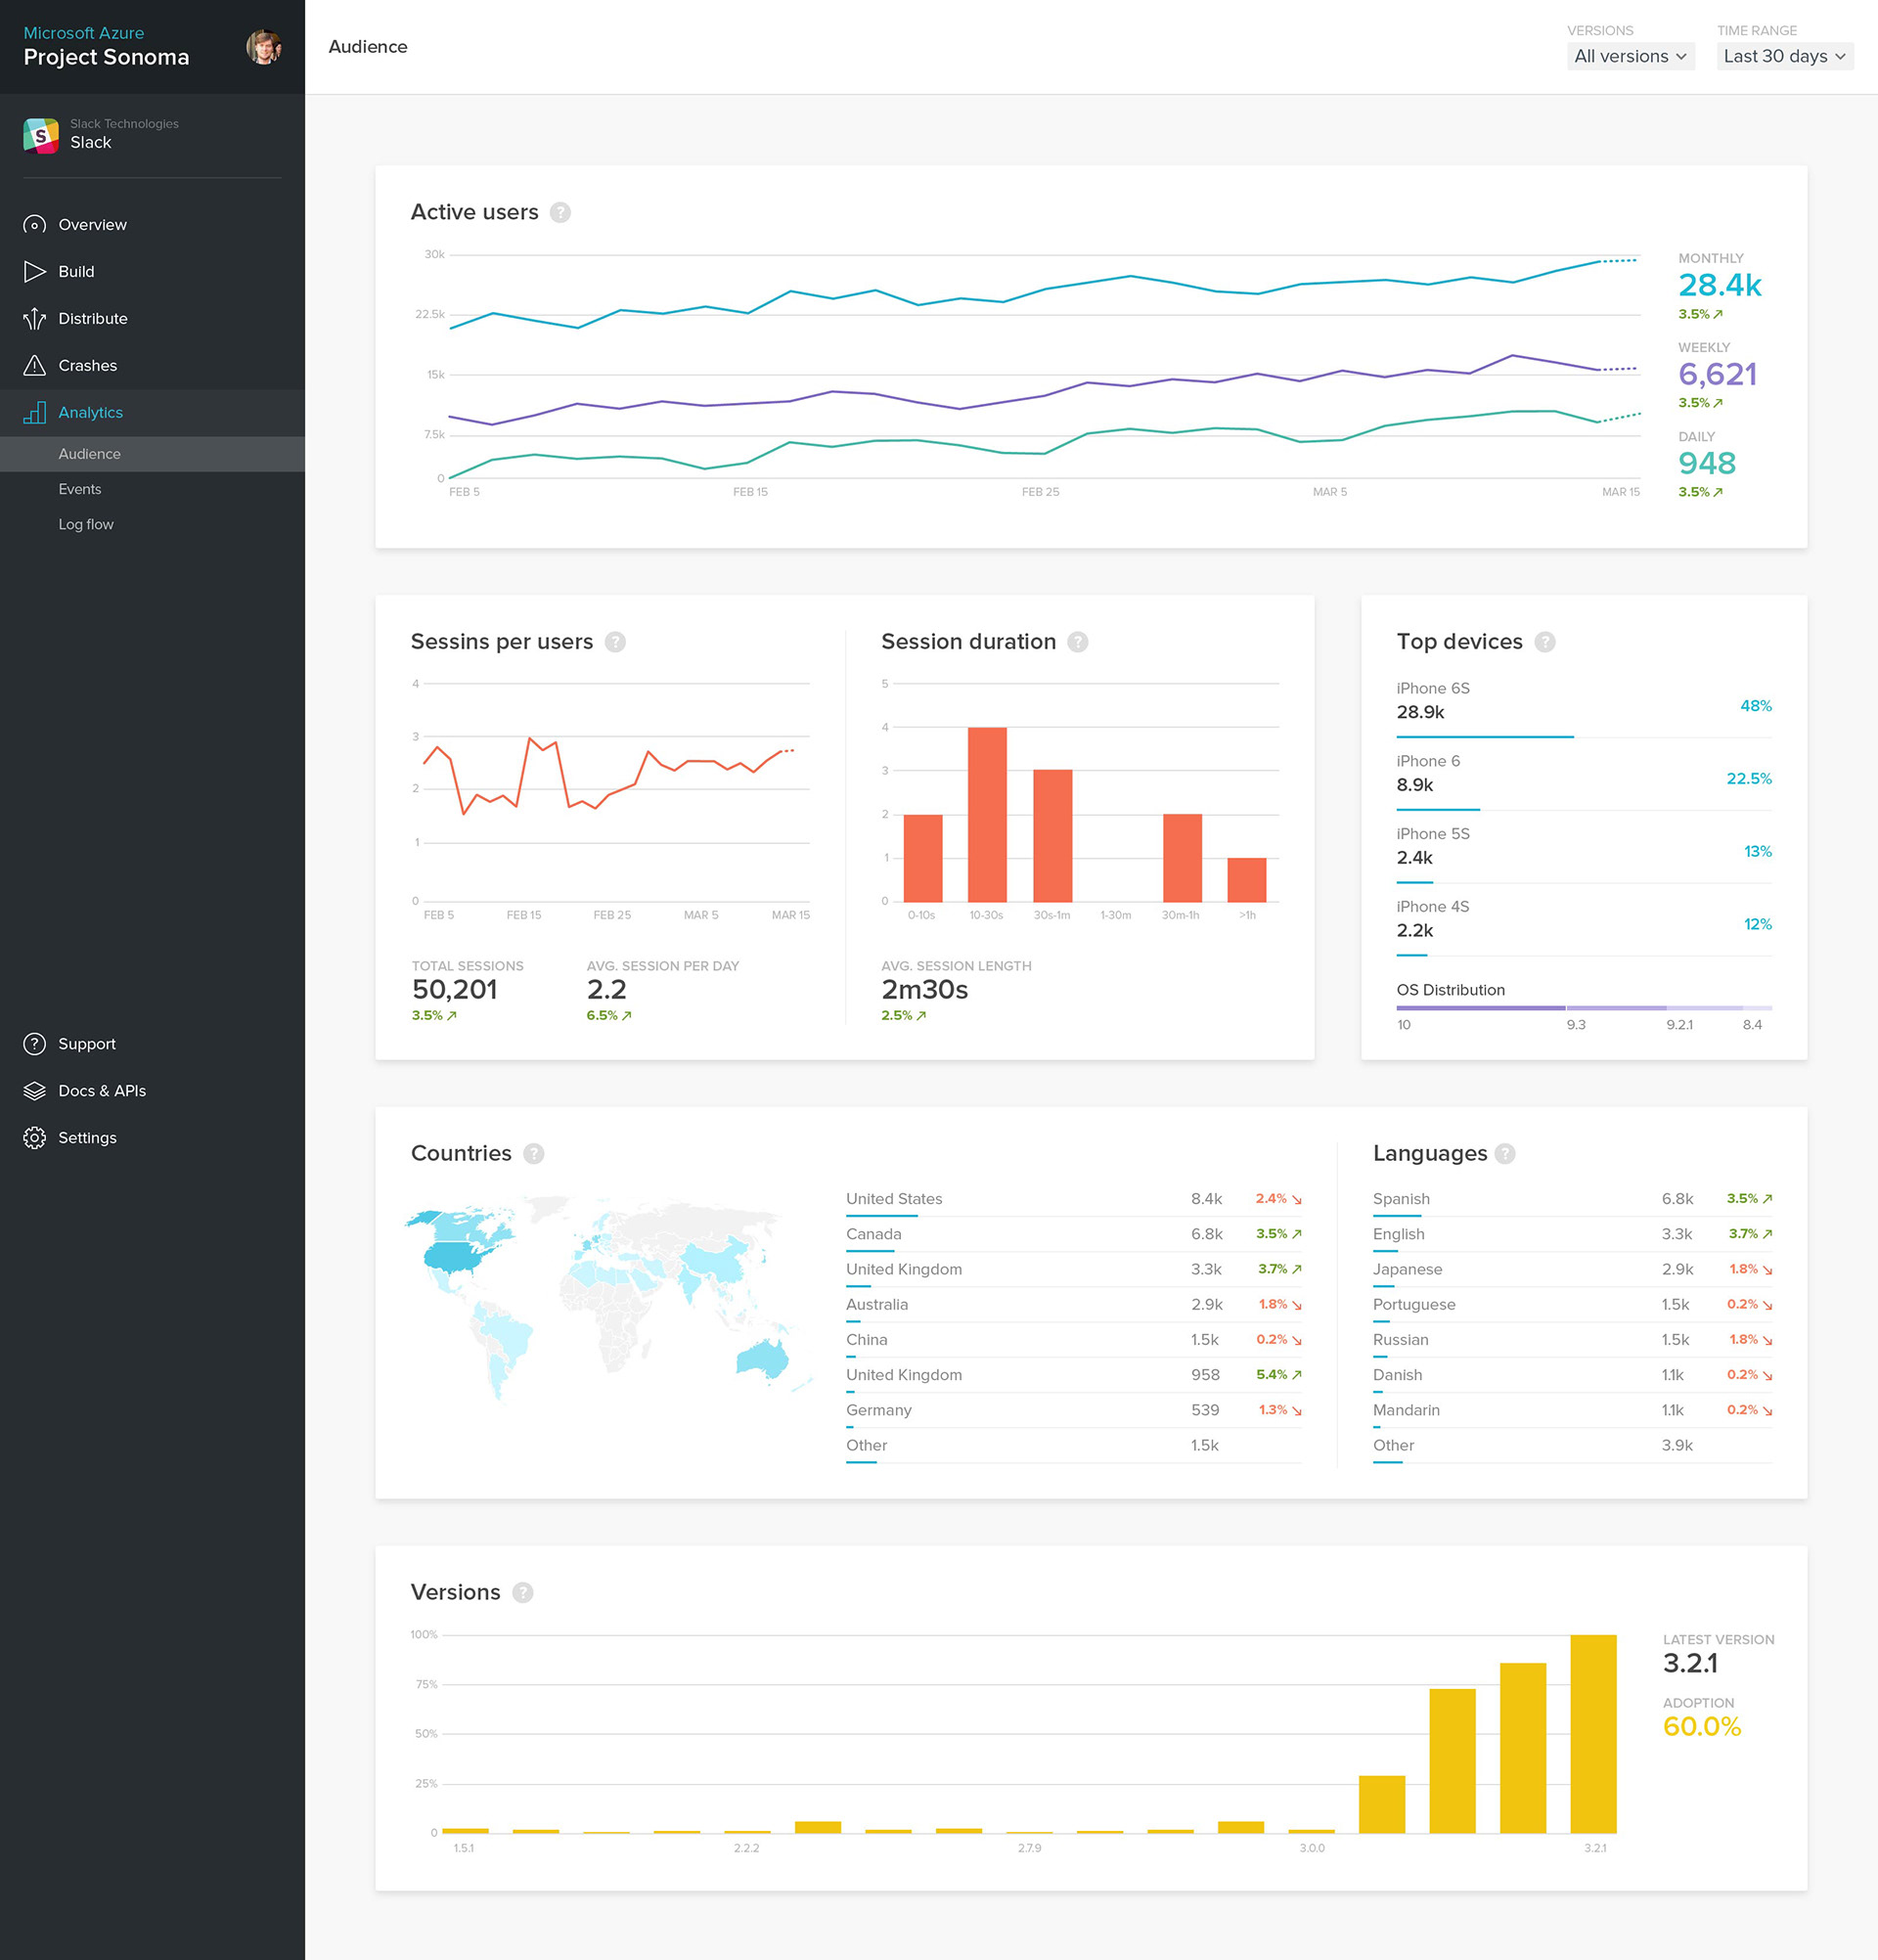
Main dashboard.
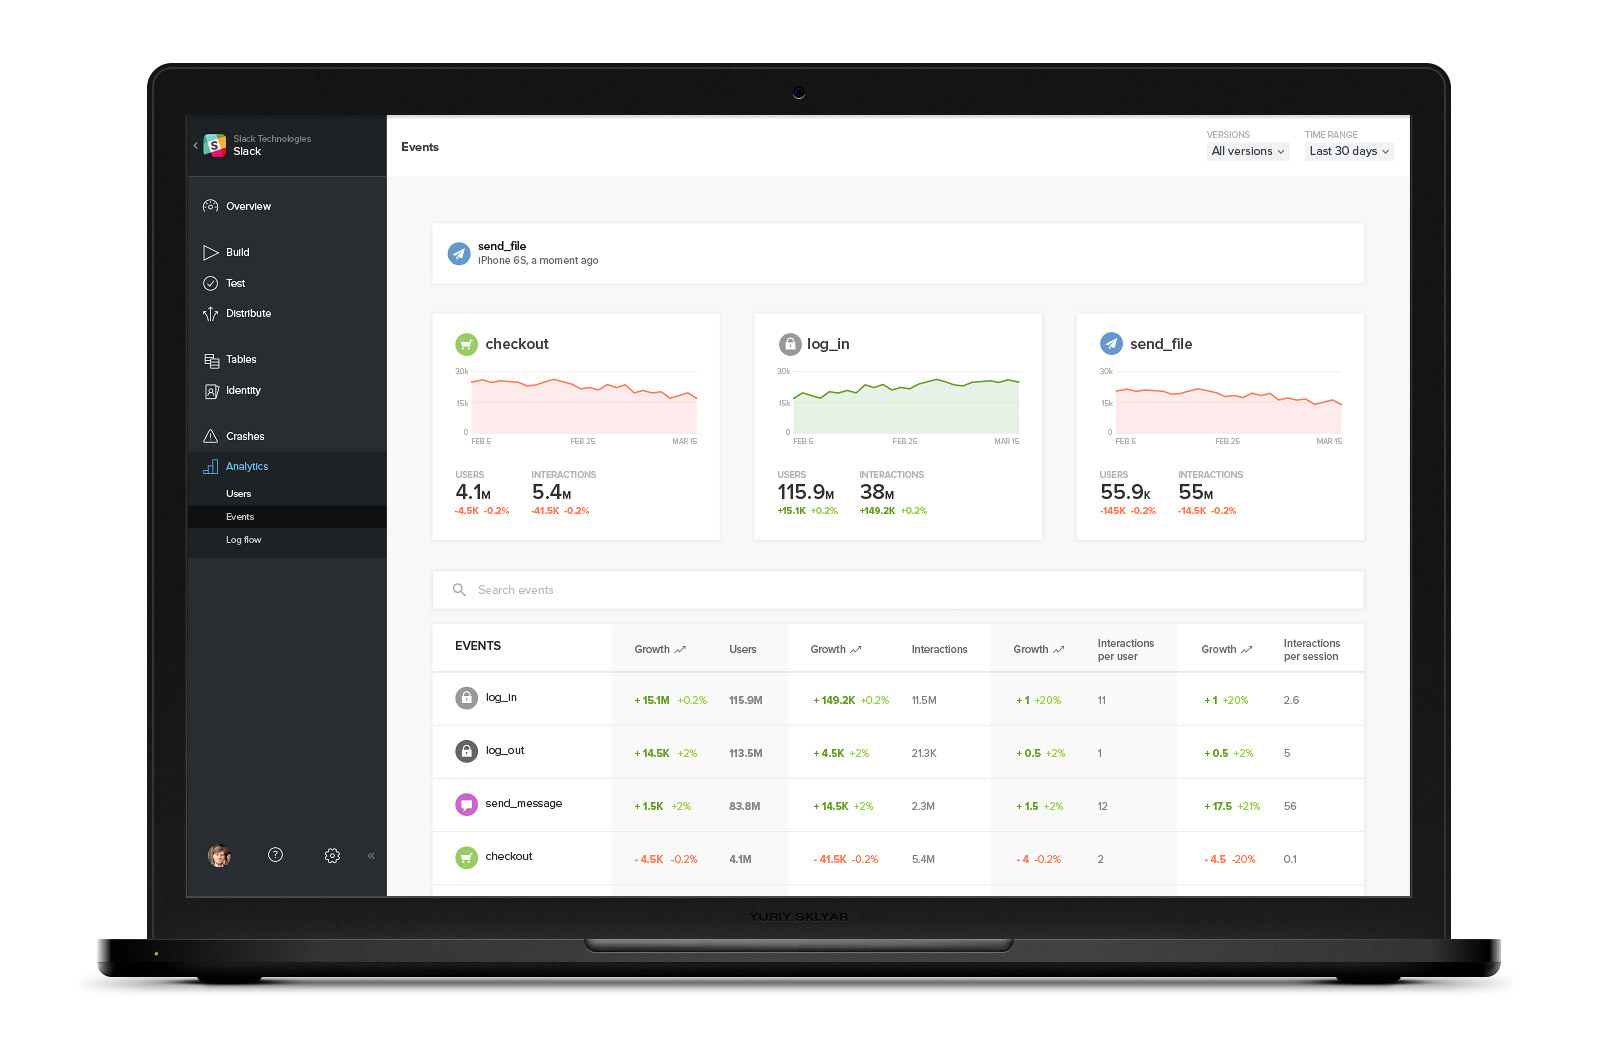
Redesigned the core analytics dashboard to make performance changes easier to scan, compare, and interpret.
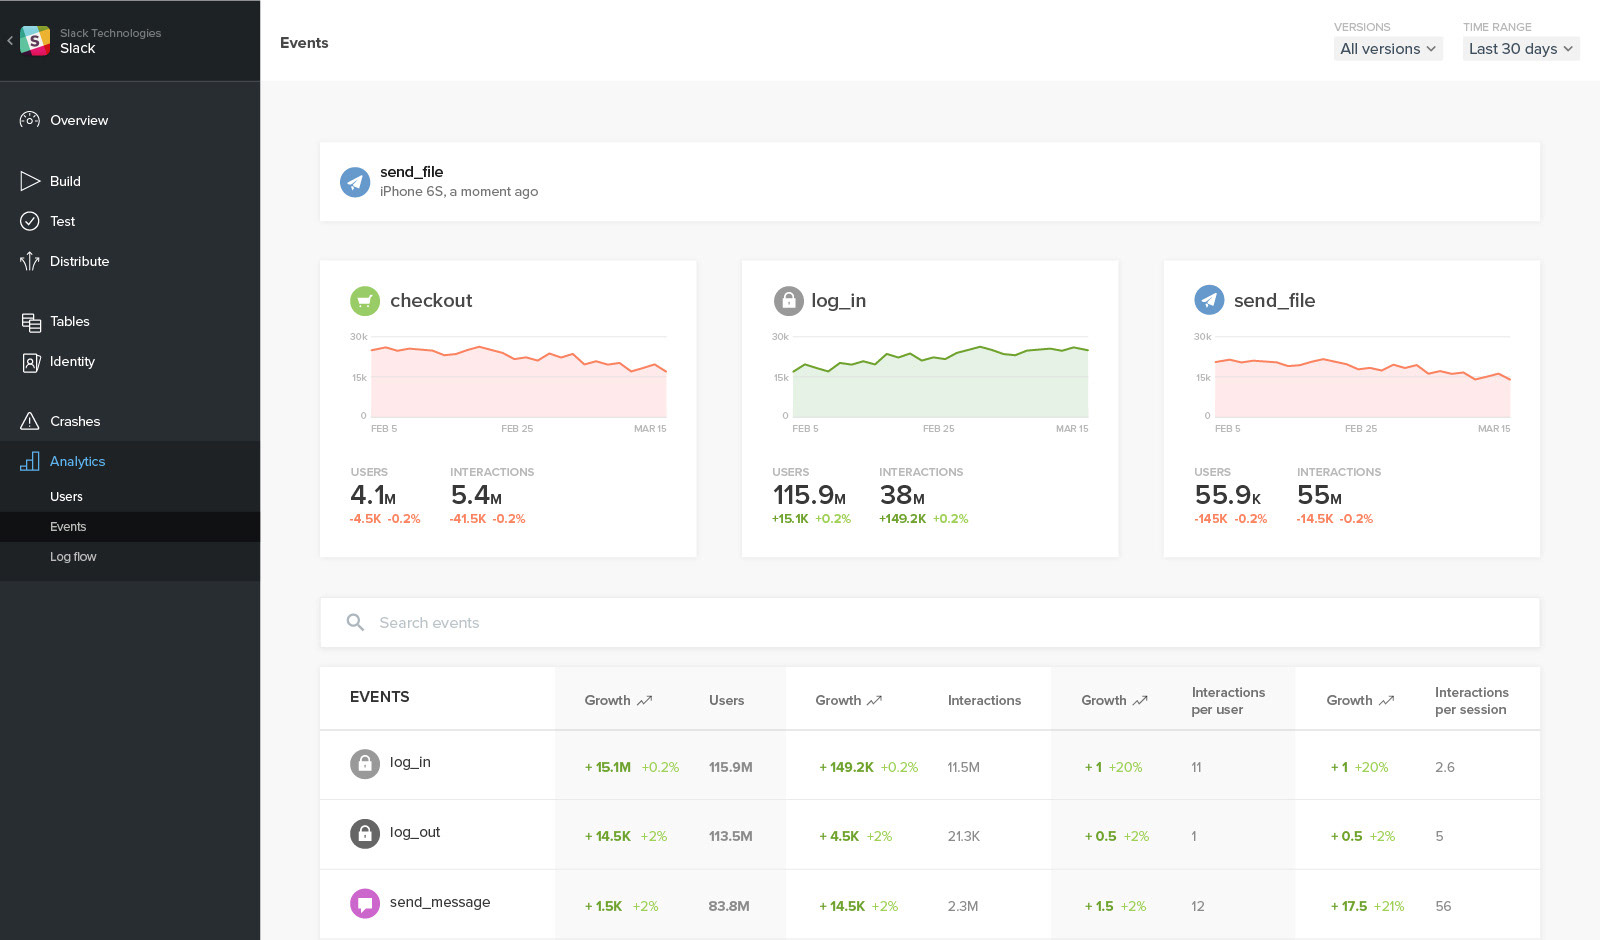
Events overview.
A user-configurable view that lets teams feature the events most relevant to them while monitoring trends, users, and interactions at a glance.
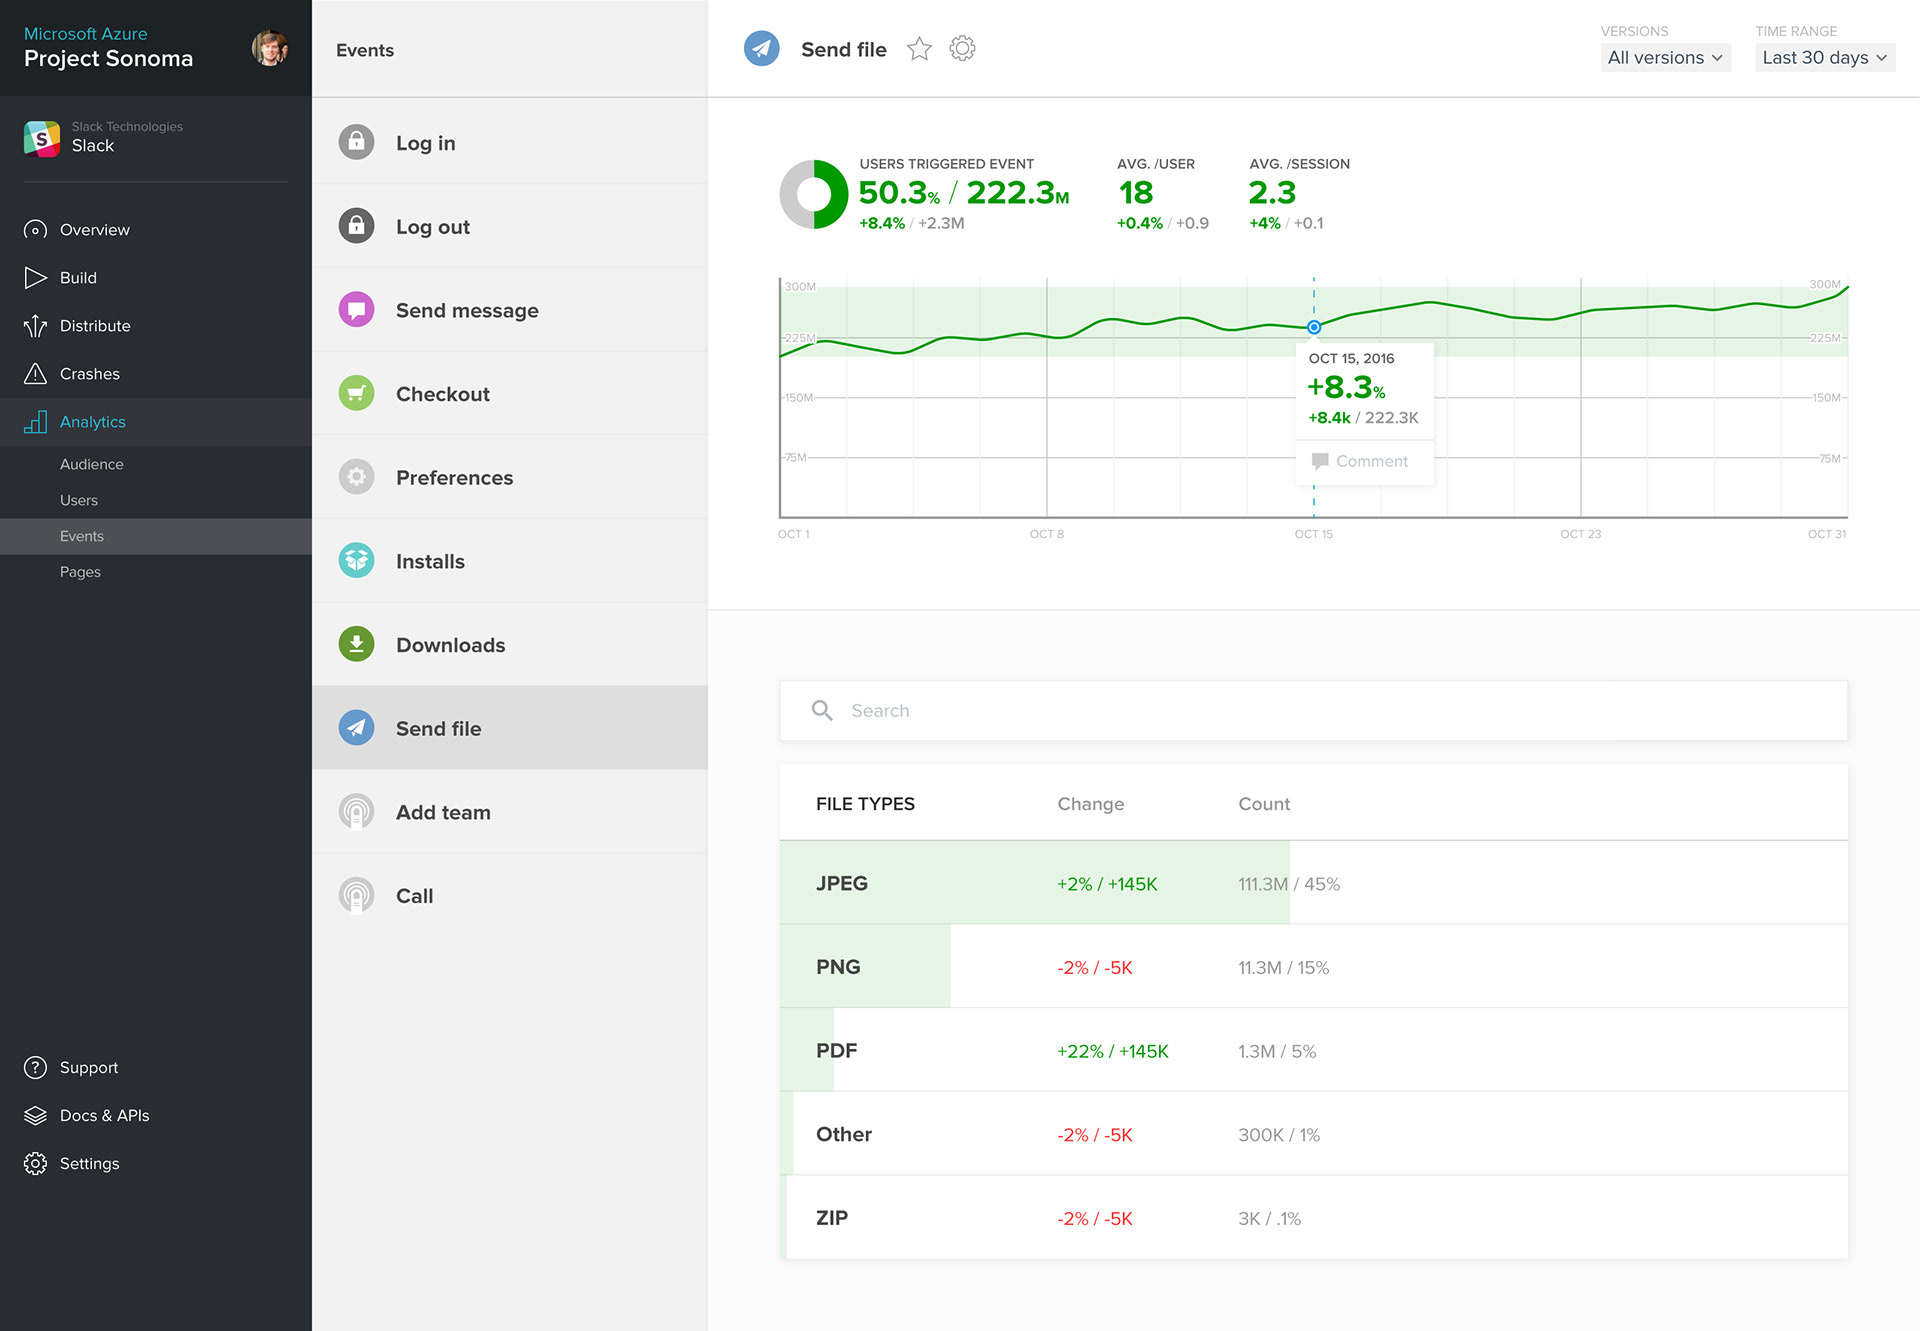
Event detail.
A focused view for analyzing event performance over time, comparing changes, and identifying the factors driving user behavior.
Trend exploration.
Created clearer paths from high-level performance signals to historical trends and supporting detail.
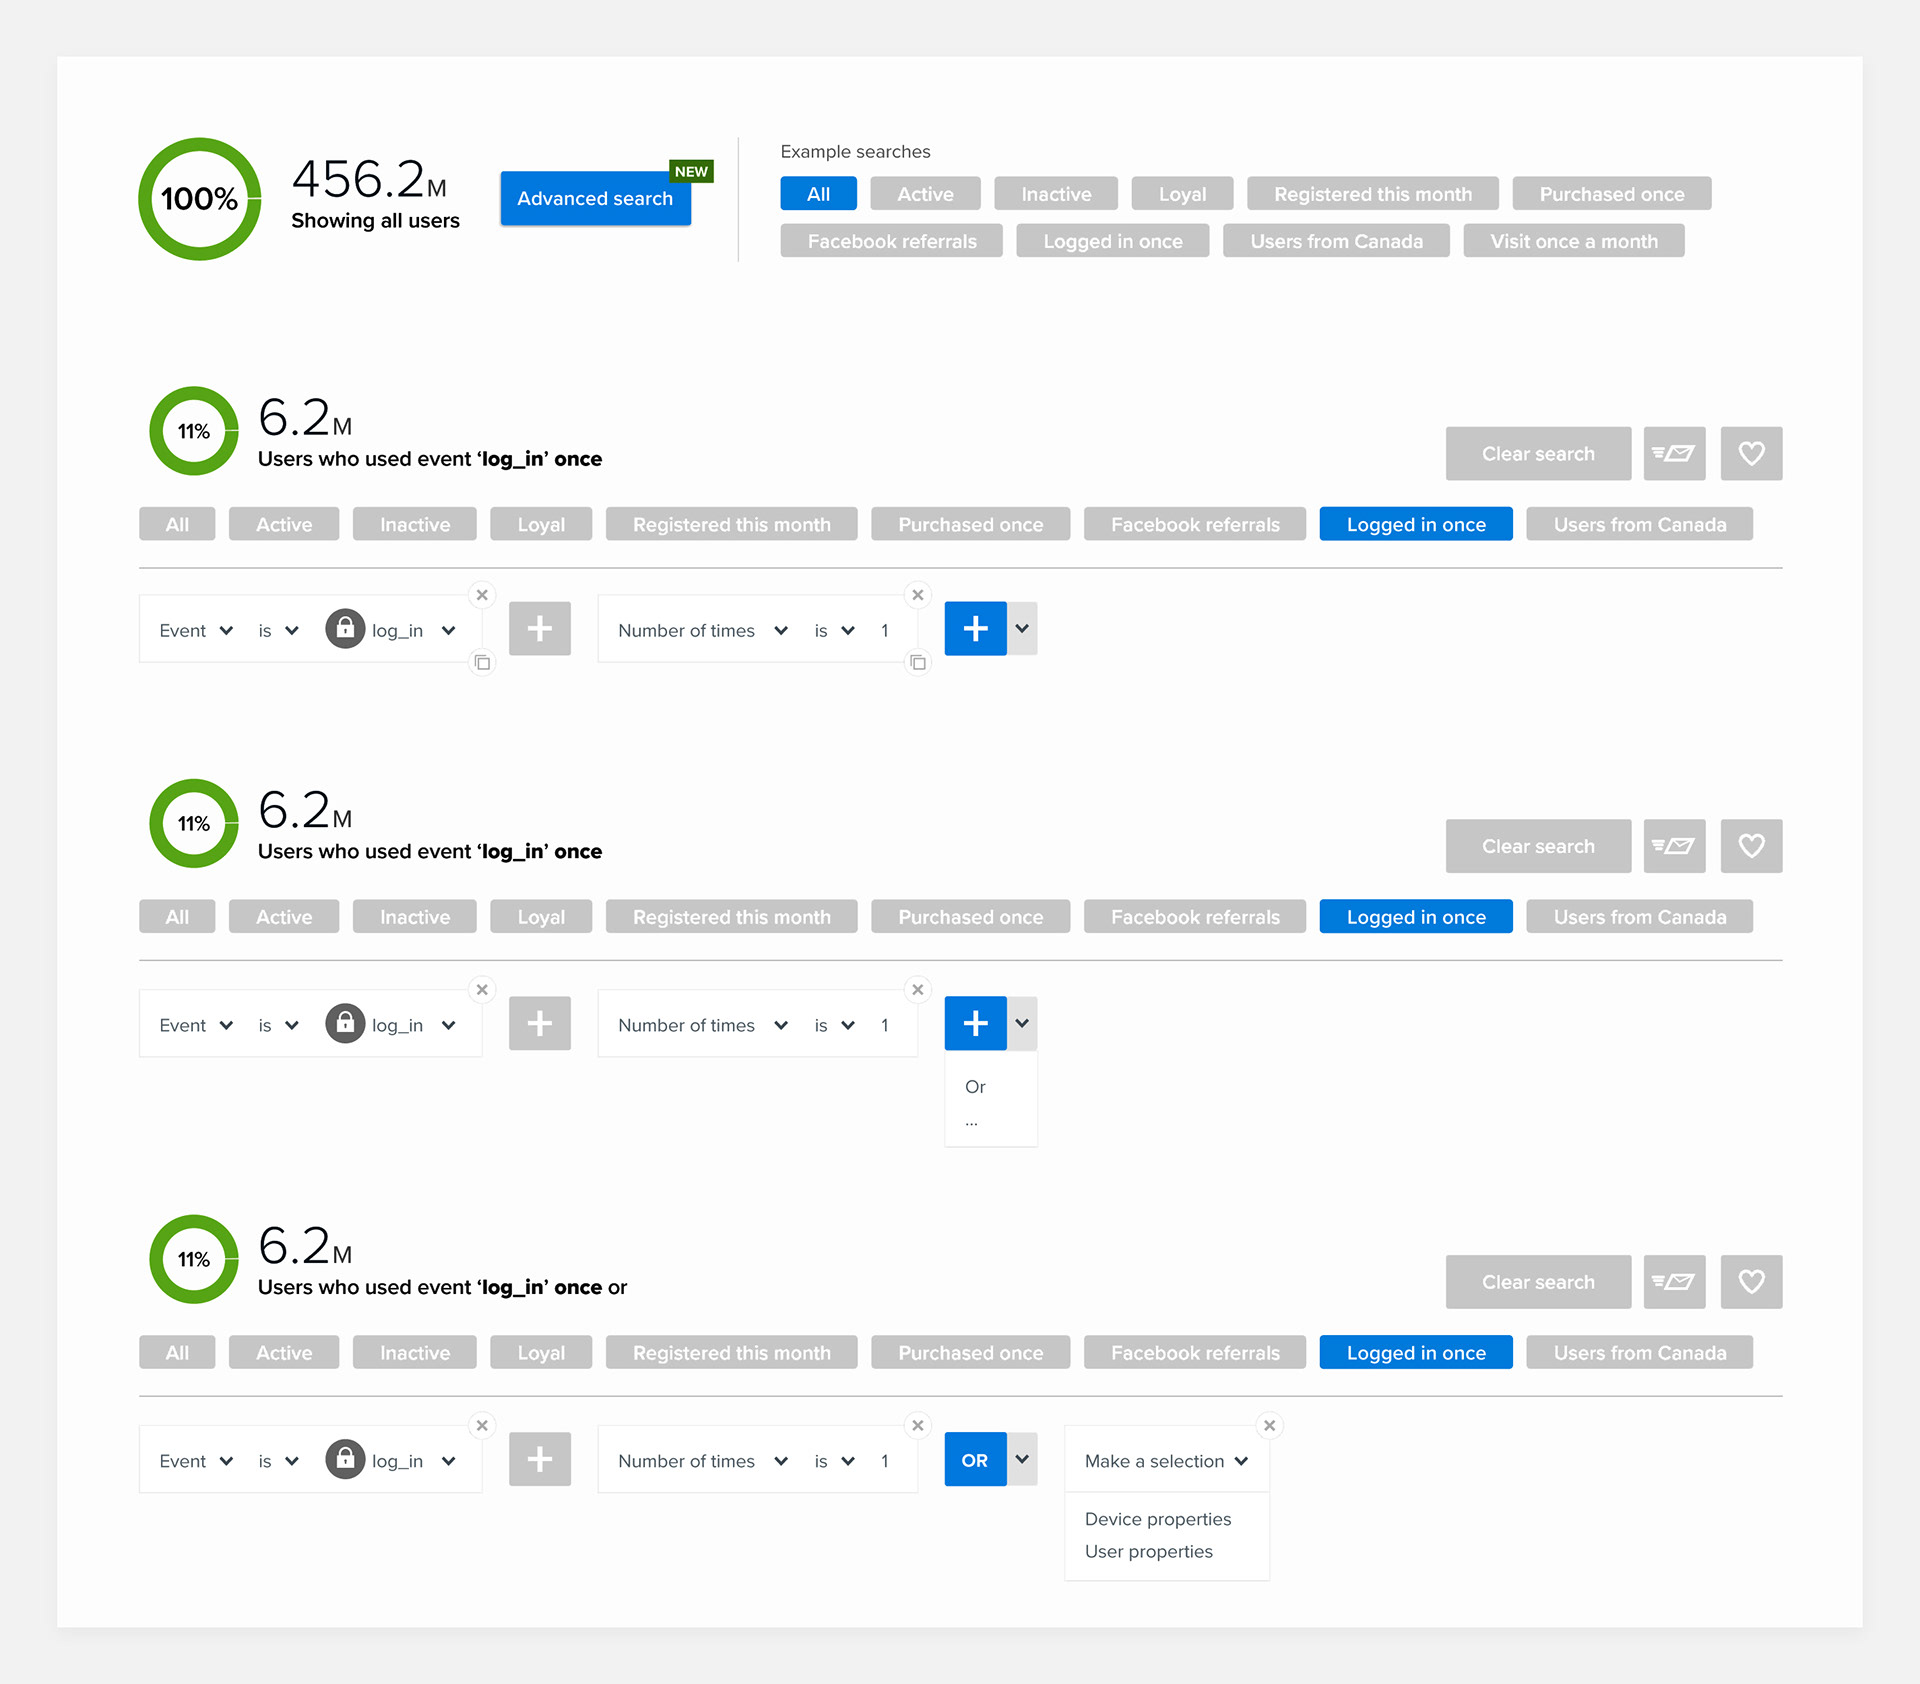
Event analysis & filtering.
Simplified event exploration, search, and filtering to help developers investigate the behavior behind changes.
Outcome
From reporting data to explaining change.
The work established a clearer direction for mobile analytics within Visual Studio Mobile Center and introduced interaction patterns that anticipated a broader industry shift toward contextual, comparative, and actionable analytics.
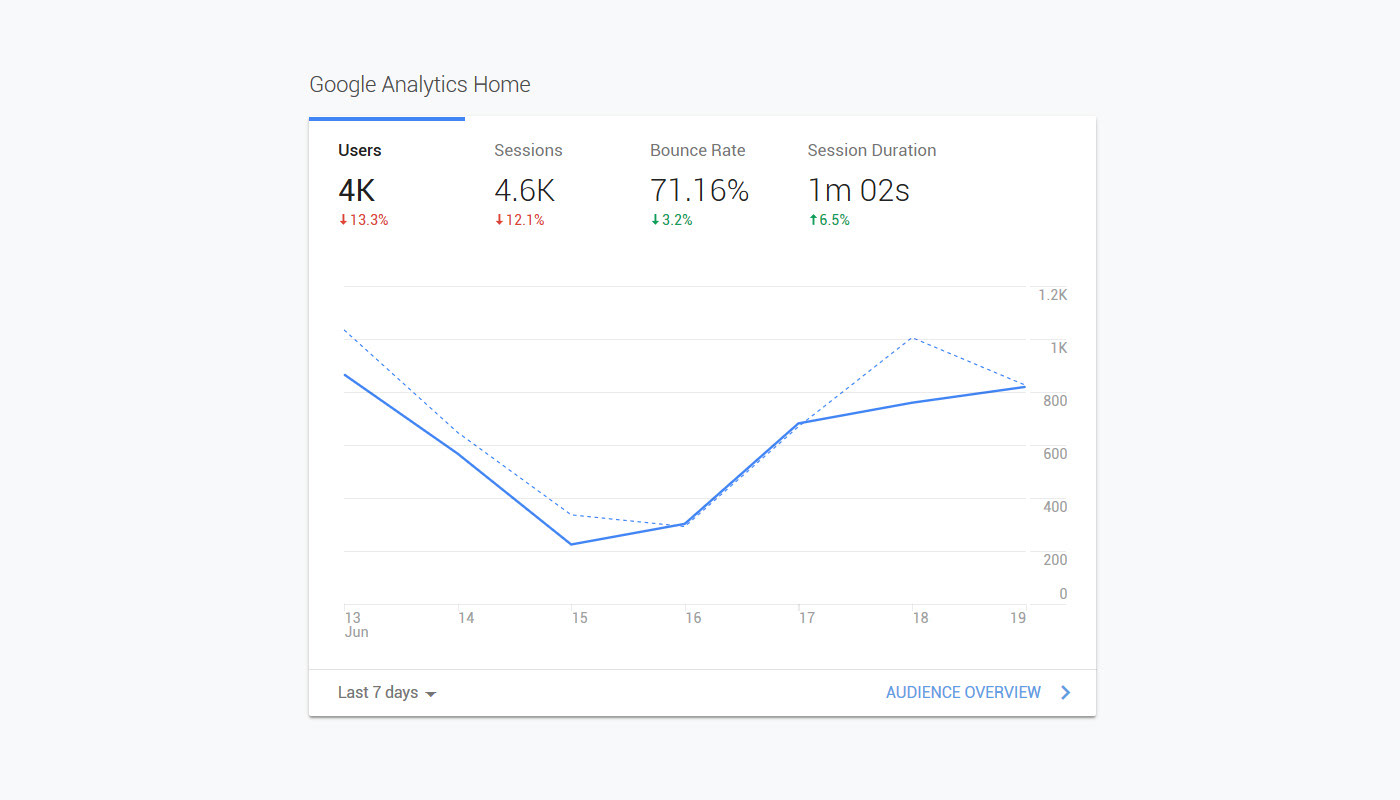
Industry validation.
Two years later, Google Analytics introduced the same core contextual delta pattern—pairing primary metrics with directional change, percentage movement, and period-over-period context.
Its adoption reinforced the broader value of the model I pioneered in 2016: helping users understand not only what the current value is, but how performance is changing and whether that change matters.
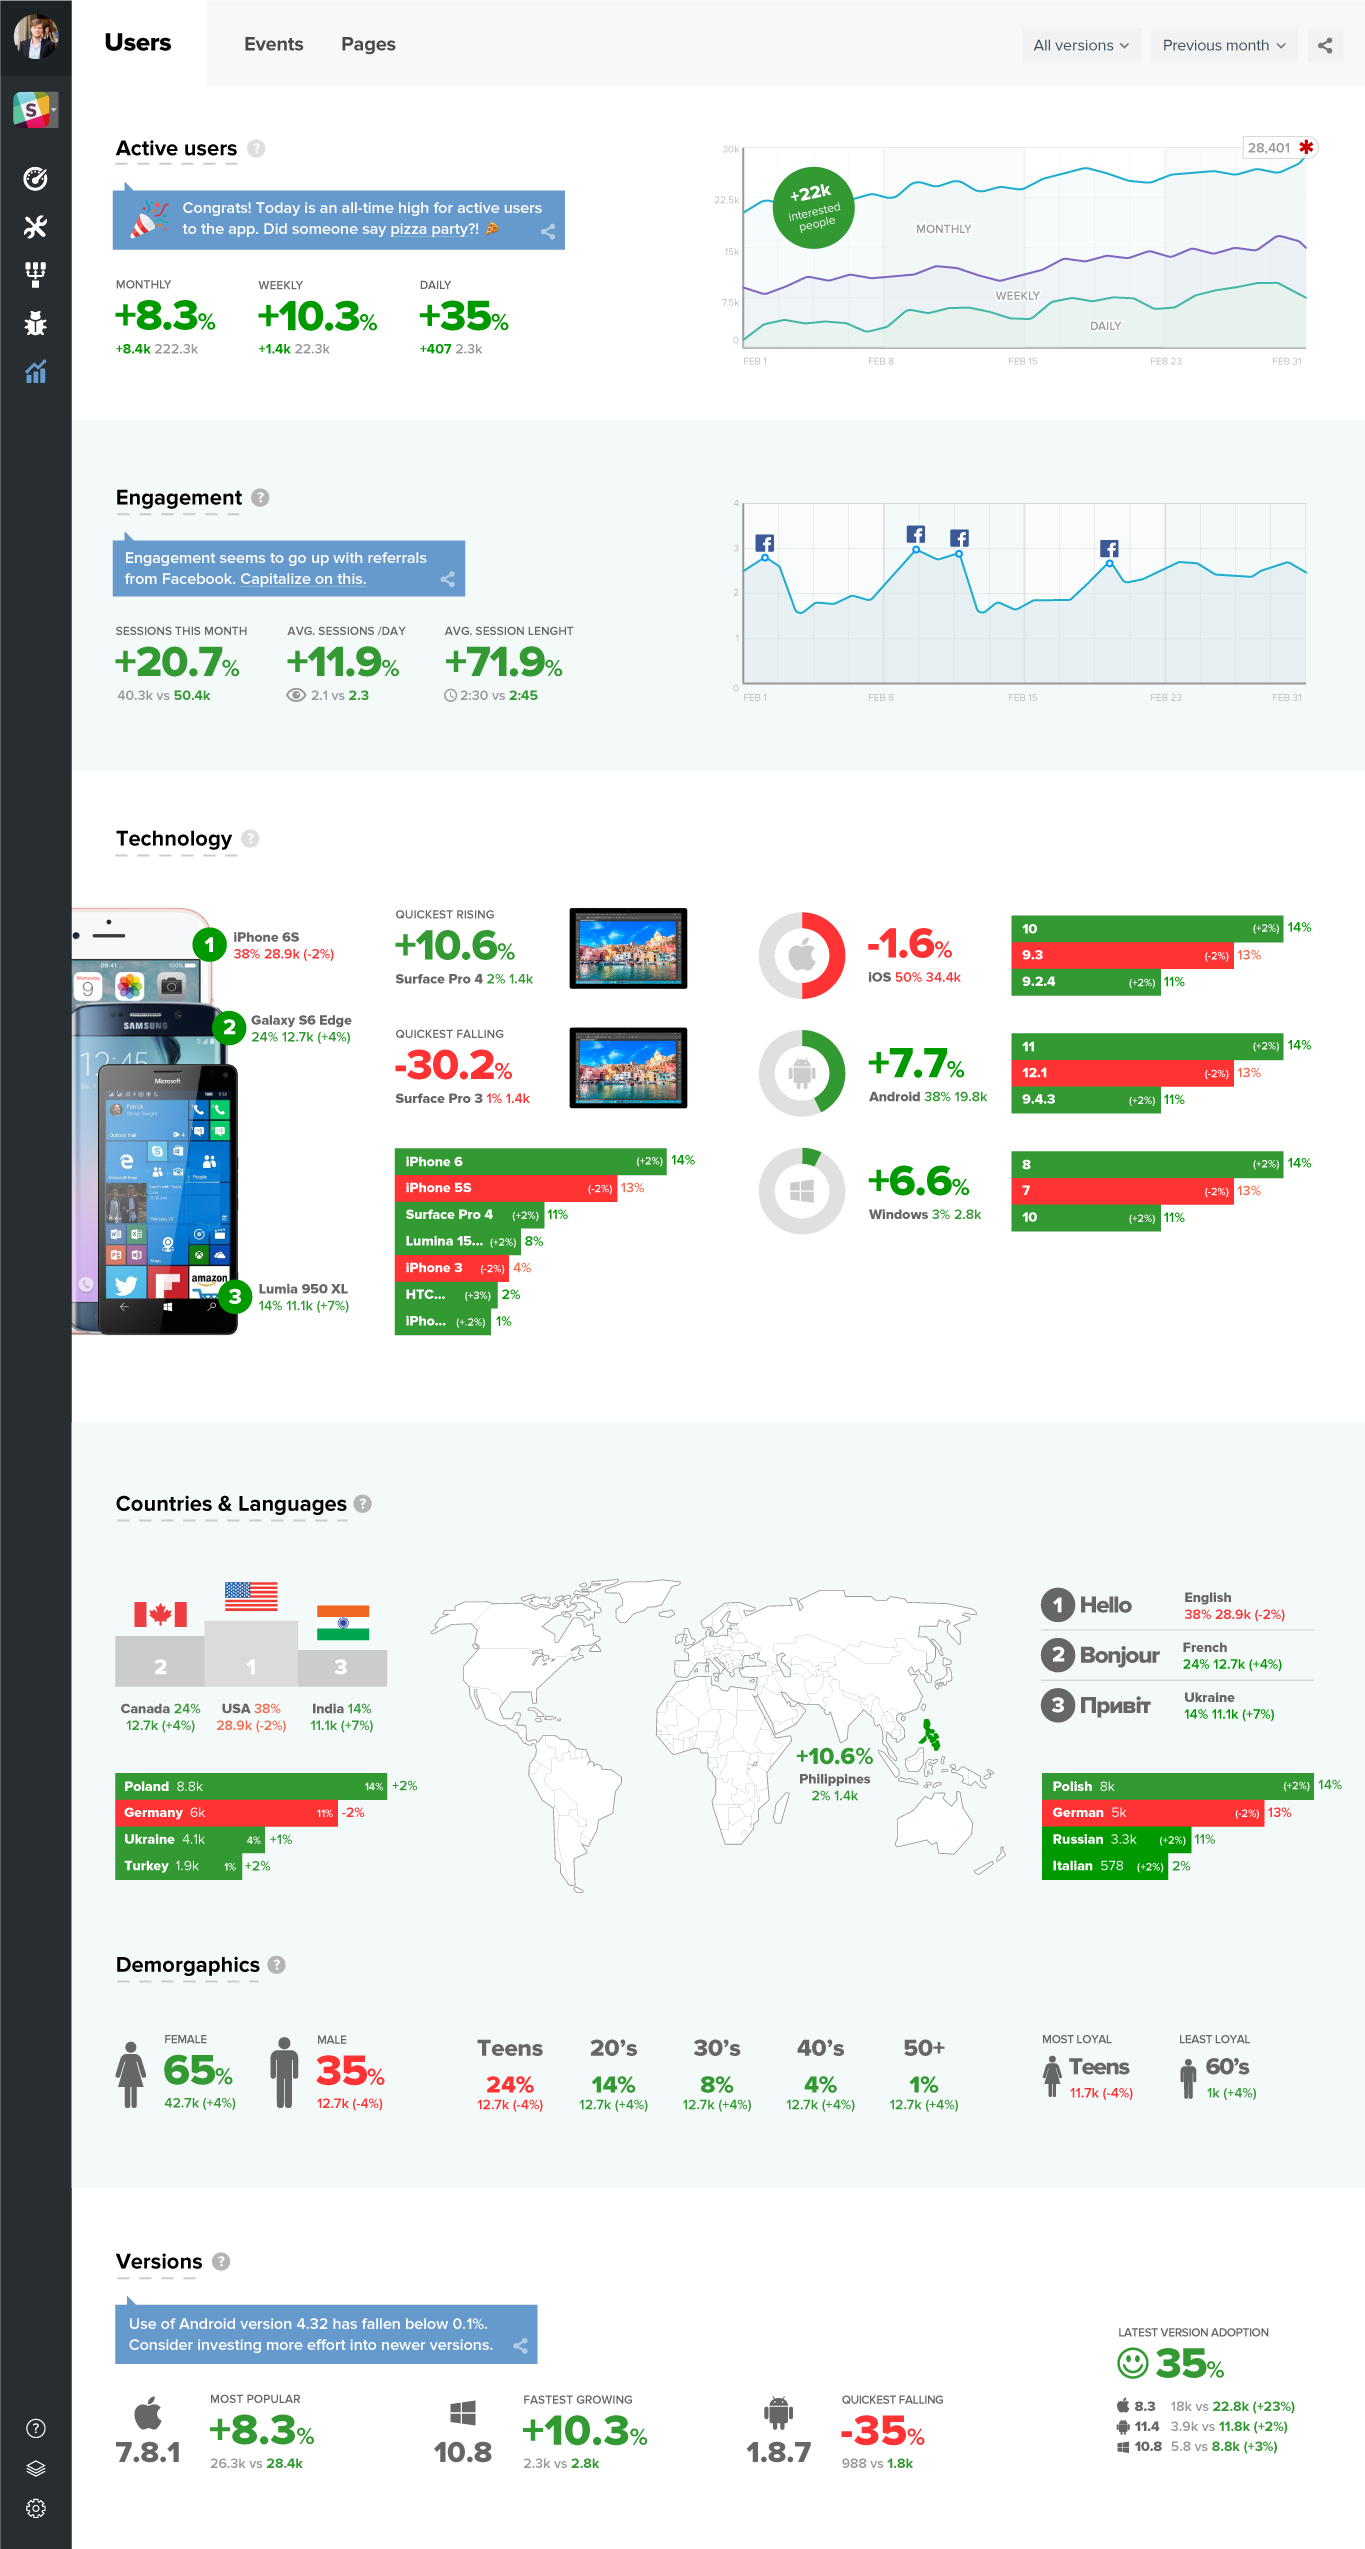
The concept that shaped the product.
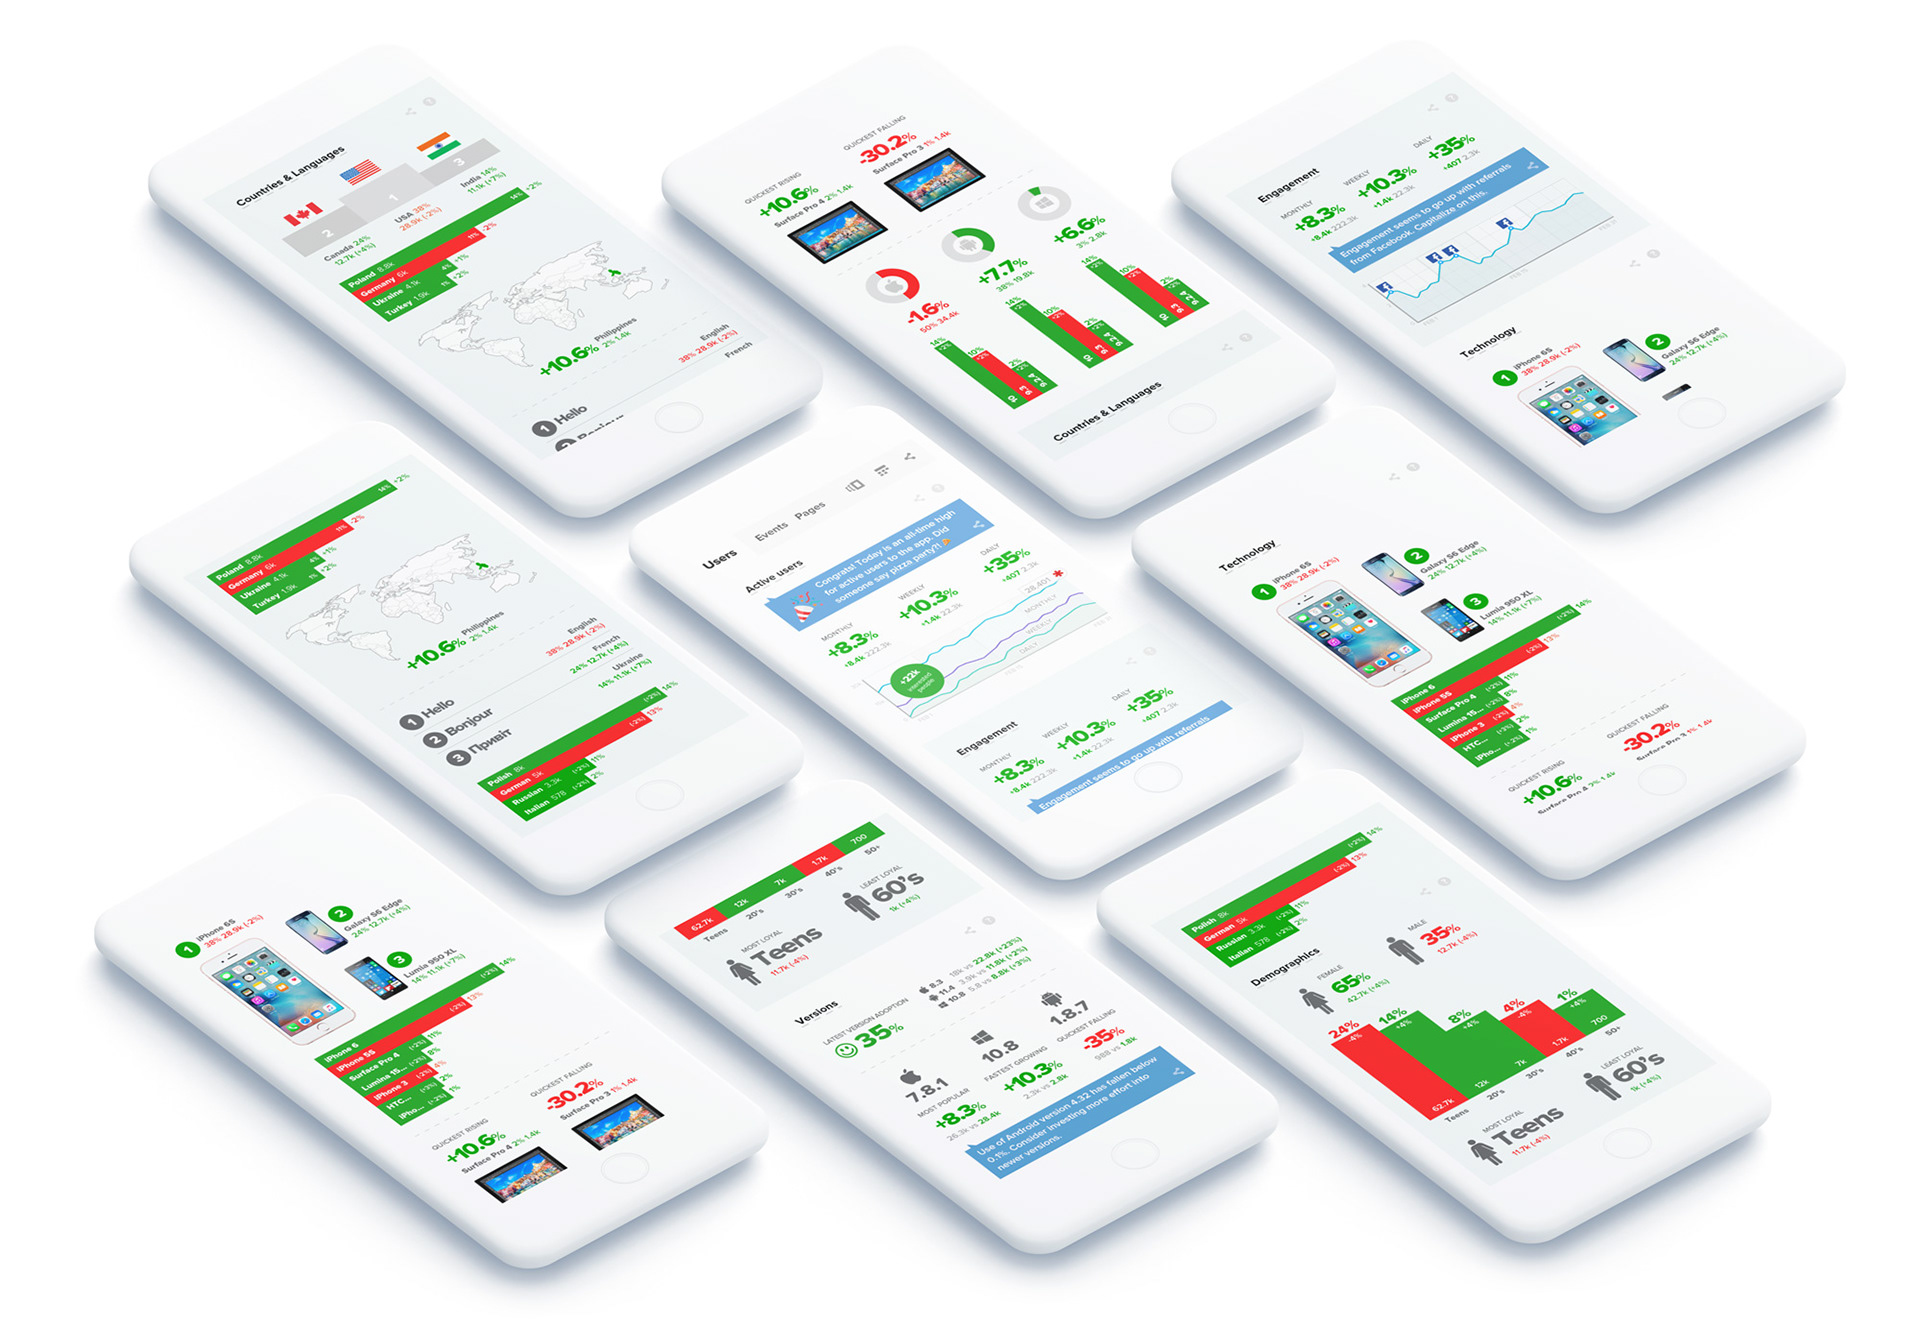
This initial concept brought the core ideas together in one cohesive experience: contextual performance feedback, comparative metrics, event correlation, proactive guidance, and clearer paths from high-level signals to deeper analysis.
While the final product evolved within Microsoft’s existing platform framework, this concept established the design direction and informed the key interaction patterns explored throughout the project.